
Release 2.9.0: Advanced data analysis, a library of sample charts and ergonomic enhancements
- New Fixed Improved
- TomekPT
- on 22-02-2024
- Improvements for AI Assistant, enabling advanced data analysis and visualization and enhanced productivity;
- A comprehensive library of sample charts enabling users to easily begin with an existing sample, including also a welcome screen to display the library;
- Important ergonomic enhancements to improve usability across our applications. These include support for keyboard shortcuts (Ctrl/Cmd + S, Esc), an undo feature in the chart editor, and an embed button within the guest mode area;
- Facelifting of public feed area featuring new thumbnail layouts for collections, the feed content now exclusively shows public collections;
- Various bug fixes and improvements;
Release 2.8.0: Revolutionary PDF experience, upgraded data spreadsheet
- New Fixed Improved
- TomekPT
- on 06-11-2023
Talk2Pdf: New, interactive and smart PDF document experience
- Upload your PDFs effortlessly to the platform and step into an exciting journey!
- Send your questions against uploaded documents to the AI assistant and receive pinpoint answers right away! This will revolutionize the way you consume PDF documents and will save you a huge amount of time!
Enhanced Spreadsheet Chart Editor
- Benefit from streamlined data import with an option to automatically replace the imported table
(for CSV or Excel imports), propelling your productivity forward. - Leverage enhanced worksheet management – now creation and removal of worksheets can be undone or redone.
- Enjoy improved styling of worksheets.
Don’t hesitate to check out the new version of Figlinq —revolution is here!
Release 2.7.0: Figlinq webpage revamp, payment enablement, upgrade of the technical stack
- Fixed Improved
- TomekPT
- on 05-10-2023
- Figlinq webpage completely remodelled to align with our new brand story
- Upgraded key components to enhance reliability and security
- Payment processing enabled (including support for 3DSecure payments) - to allow sign-up to the platform
- Revamped system icons for a fresh look and feel
- Improved email notifications for collaborators who don't have Figlinq accounts.
- Fixed an issue related to bulk file move operations.
Release 2.6.5: New logging infrastructure
- Improved
- Przemek
- on 12-08-2023

We upgraded our logging and monitoring infrastructure. This is a release that will have no effect on user experience, but will improve the reliability of our systems.
Release 2.6.3: Align plots with precision in figure editor
- New
- Przemek
- on 31-07-2023
Users can now align selected plots along the X or Y axis with a single click in figure editor. The alignment considers scales, margins, and various plot properties for precision. The tool identifies a reference plot, aligns selected plots relative to it, and requires a minimum of two plots to be selected. Intelligent handling of non-plot elements is also implemented, preserving the integrity of the selection. This new feature enhances visualization and saves time by eliminating manual adjustments.
Release 2.6.0: AI Assistant
- New
- Przemek
- on 21-07-2023
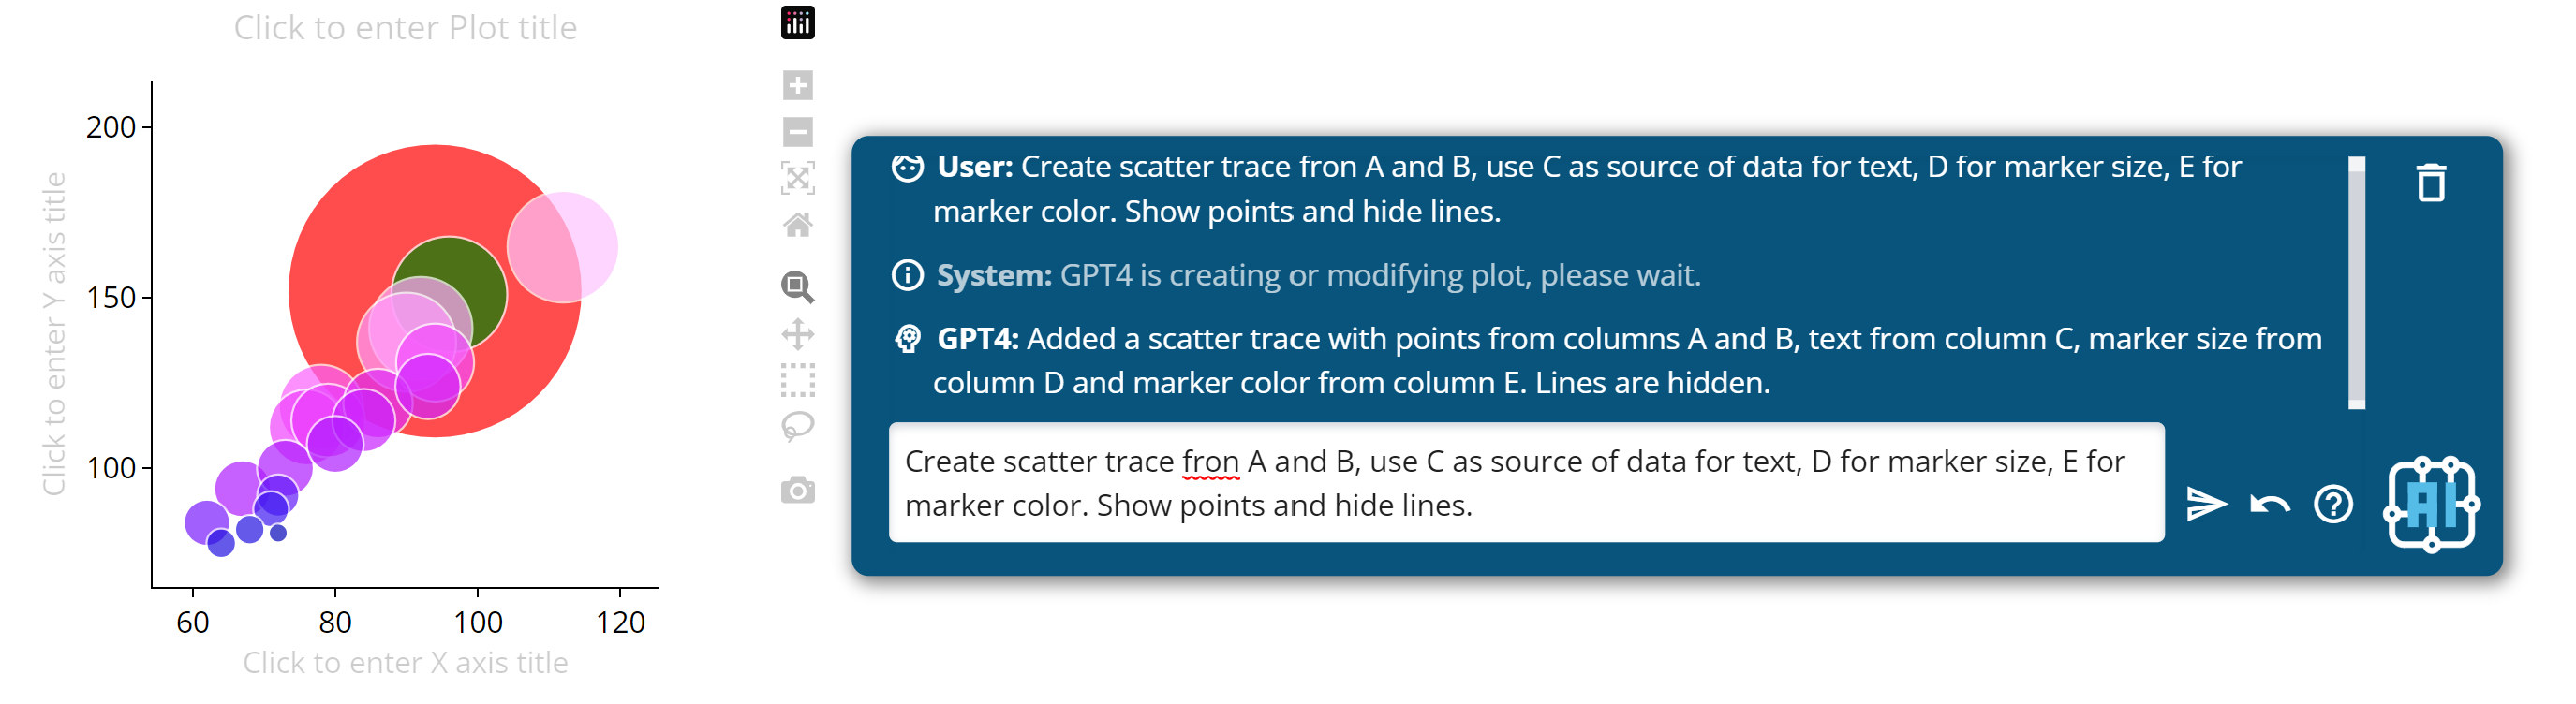
We have integrated a new feature called the AI Assistant, powered by OpenAI's GPT-4 language model. This advanced feature uses Natural Language Processing (NLP) to interpret text prompts, automating various tasks within the app including:
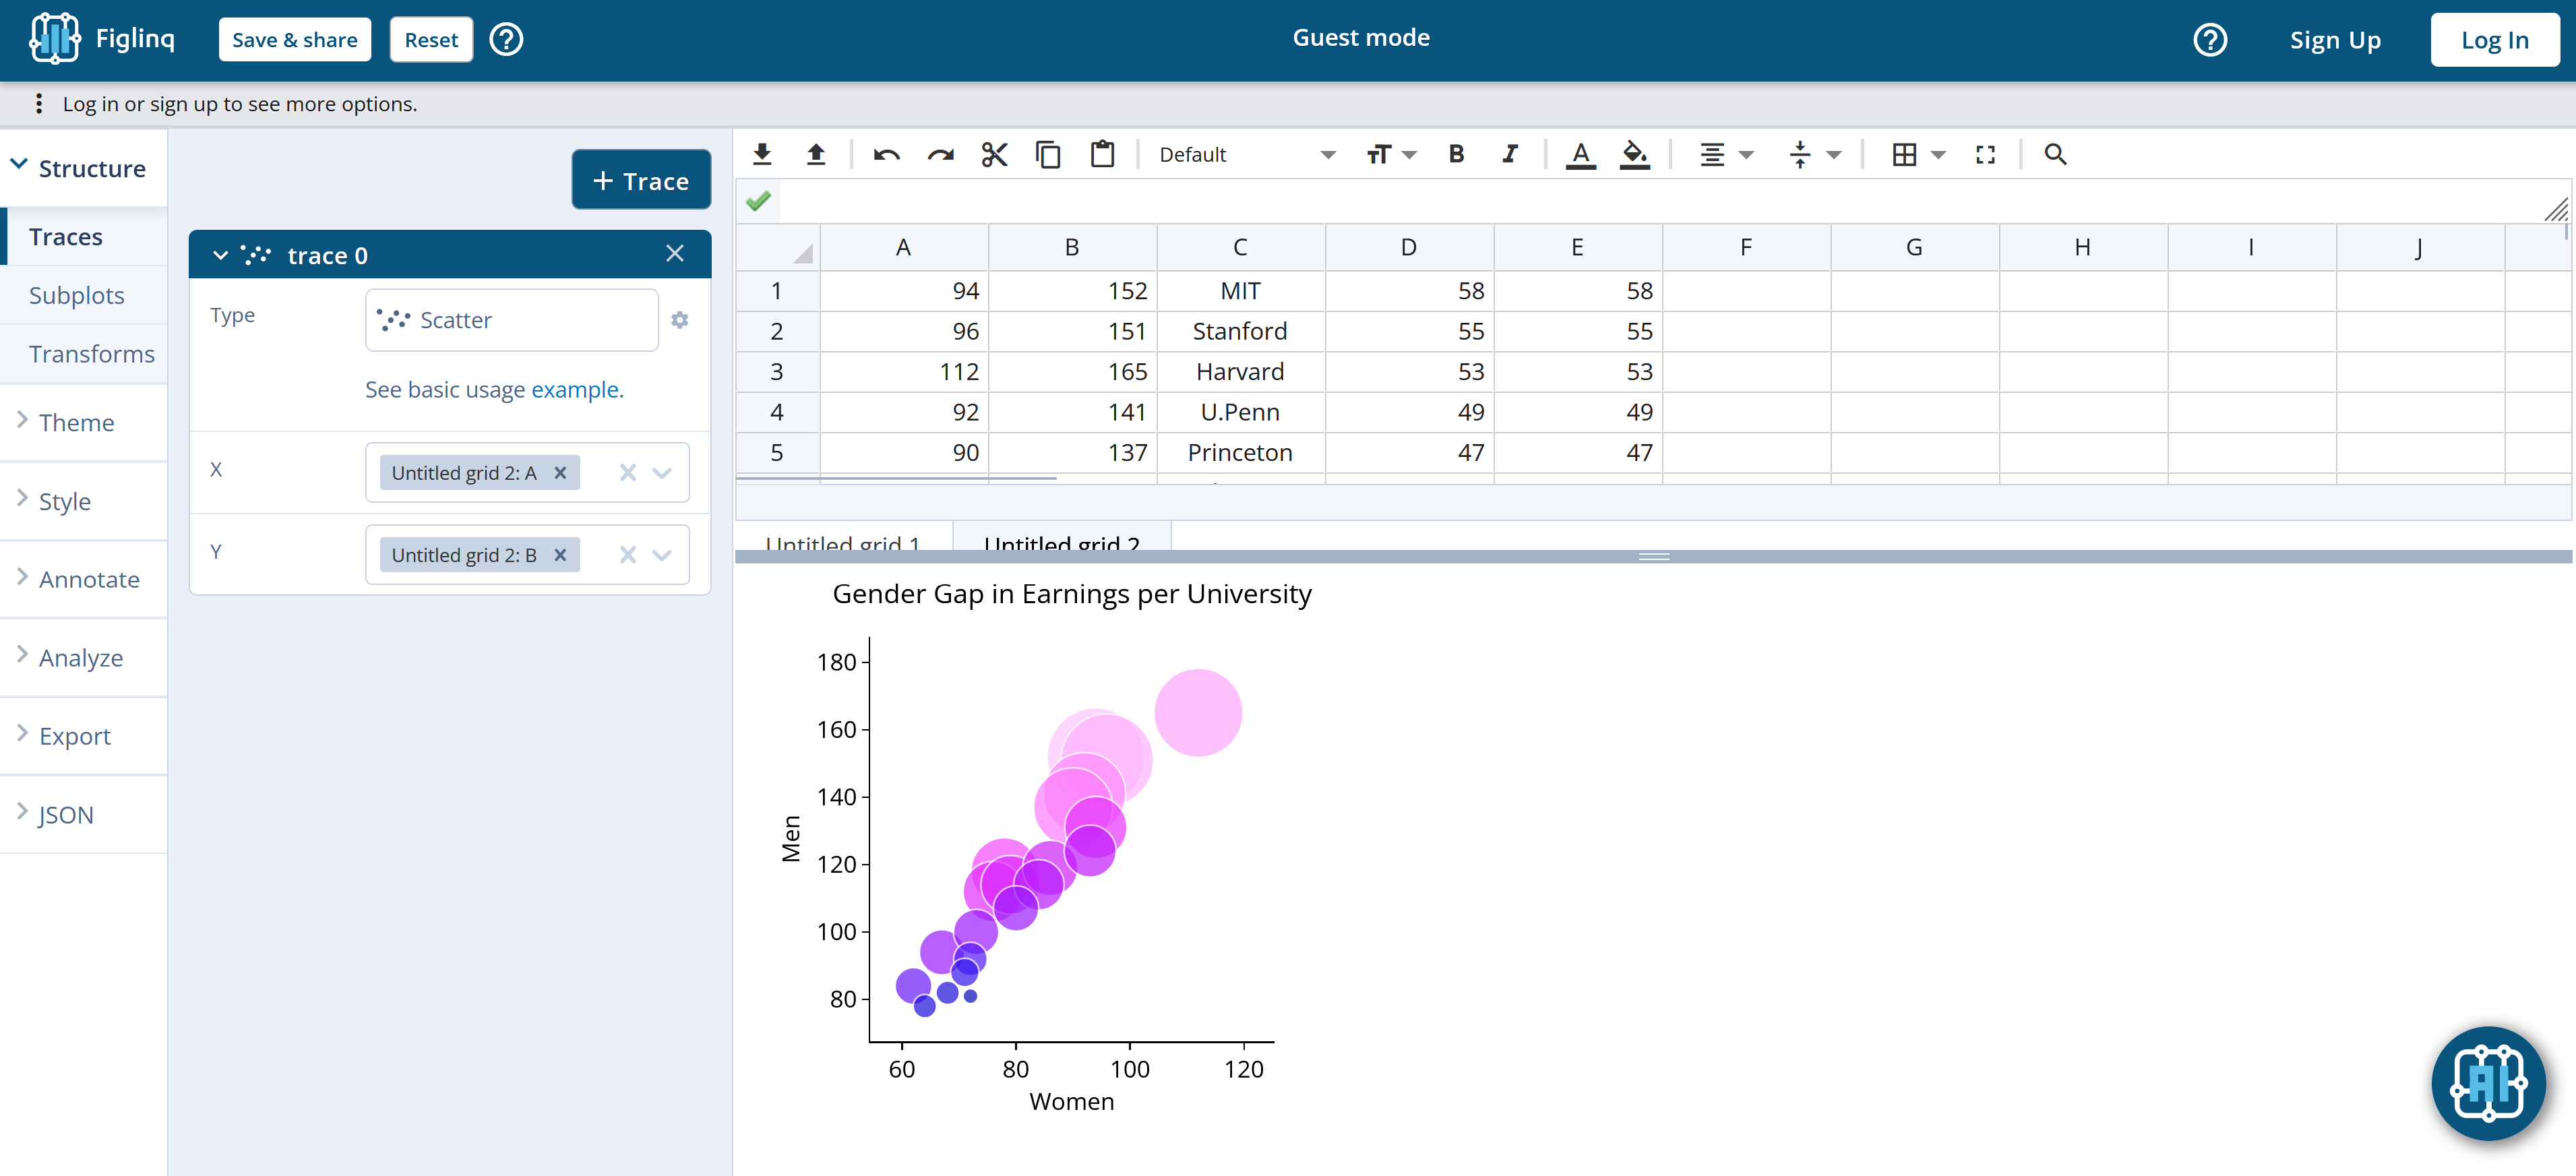
- Creating Plots via Text Prompts: Users can now create a new trace by typing a text prompt. The AI Assistant interprets your prompt and generates a trace based on the data from specified data grid columns.
- Modifying Existing Plots via Text Prompts: The AI Assistant is capable of modifying existing plots based on user prompts. This feature is available in both the data visualization area and the figure editor.
- Performing Calculations and Data Generation: The AI Assistant can perform a variety of calculations in the data grid and add new data to it based on user prompts.
- Data Analysis: The AI Assistant has the ability to analyze the data present in your grid. It interprets and analyzes specific columns of data based on user prompts, taking headers into account when analyzing the data.
For more information visit documentation page.
Release 2.6.0: Roadmap, bug reports, feature requests and community forum
- New
- Przemek
- on 21-07-2023
We're excited to announce the addition of a new feature - Feedback Forum. This tool aims to bridge the gap between our team and the user community, offering a more structured way to share, discuss, and prioritize ideas, problems, and solutions. The Feedback Forum includes the following boards:
- Community Q&A: Here, users can post their questions and engage in enlightening discussions. You can help out fellow users by answering their queries or learn from the responses given by others.
- Changelog: This board keeps you updated with the most recent changes, updates, and improvements in the app. Stay up-to-date and make the most of the enhancements.
- Feature Requests: Got an idea that could make our app better? We're all ears! Post your suggestions here, and let the community vote on it. Popular ideas with high votes get higher visibility, potentially influencing our product roadmap.
- Bug Reporting: Encountered an issue? Report bugs in this dedicated space, helping us pinpoint and resolve problems faster.
- Roadmap: We're transparent about our plans. Check out our roadmap to see what we're currently working on and what's planned for future releases.
The forum is available to all registered users who can post and vote on the posts, actively contributing to shaping the future of our app. As always, we look forward to your valuable feedback and discussions in the forum. Together, we'll make the app even better!

Visit the forum here (you need to log in first to post & vote).
Release 2.6.0: Creating and sharing plots without account
- New
- Przemek
- on 21-07-2023
In our continuous efforts to enhance user experience, we now allow registered and unregistered users to take advantage of our powerful interactive data visualization features. This upgrade makes it possible for users to process, analyze, visualize, and share their data without creating an account.
Click here to visualize and share now, and here for more information!
Release 2.6.0: Spreadsheet formulas for statistical analysis
- New
- Przemek
- on 21-07-2023
We have added a range of statistical formulas to our spreadsheet application. The new formulas provide a variety of statistical analysis methods, including T-tests, Chi-squared tests, Fisher's exact test, Barnard's test, the binomial test, the sign test, the Mann-Whitney U test, and ANOVA.
Check statistical formula documentation page for more details - and submit a feature request if you would like to include more formulas!