1
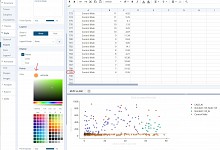
Scatter plot style adjustments do not work
- Under review
- Subscribe
|
Y |
y.r.jaspers |
Scatter plot style adjustments do not work for data sets with >700 data points. I can share the plot if necessary.


Activity Newest / Oldest
Przemek
Could you send us the original dataset (csv or excel ) that you import or paste from? You could email it to info@figlinq.com. We're trying to figure out how this error comes about, as it cannot be reproduced with other datasets, or even with your dataset when a trace is re-added.
In any case, it doesn't have anything to do with the number of points.
Przemek
Hi, I can confirm the issue, we will investigate. But if you just remove the trace and add it again, everything works fine.
y.r.jaspers
I also shared the plot
y.r.jaspers
My guess is every style adjustment. I tested, color, size and border style
Przemek
Yes, please share! What style adjustments? Just changing point color?
Przemek
Status changed to: Under review