4
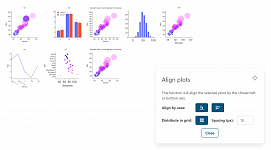
We just released a powerful new feature that allows you to align your plots effortlessly on a grid, considering elements that extend beyond the axes, such as plot or axes titles, labels or legends.
Available in figure editor in menu Plot >> Align axes
How It Works:
- Select and roughly arrange your plots (at least 2) in rows, columns or in a grid.
- Reference Plot Detection: The feature identifies the upper-left-most reference plot to align the selected plots relative to it.
- Precision Alignment: Alignment considers scales, margins, and various plot properties to ensure that your plots' axes align perfectly.
- Easy Handling of Non-Plots: If a selected element is not a plot, it is intelligently handled and not moved, preserving the integrity of your selection.
Why You'll Love It:
- Saves Time: No more manual adjustments - get perfect alignment every time!
- Enhances Visualization: Make your data more understandable with well-organized plots.
- Works Seamlessly: Whether you want to align the plots along the 'x' or 'y' axis, this feature has you covered.
We hope you enjoy using this new feature and that it helps streamline your plotting and data visualization process. Your feedback is always welcome, as we continually strive to enhance and simplify your user experience.
[Expiry date: 2023-08-08]


